

Last Updated on May 26, 2026 by Admin
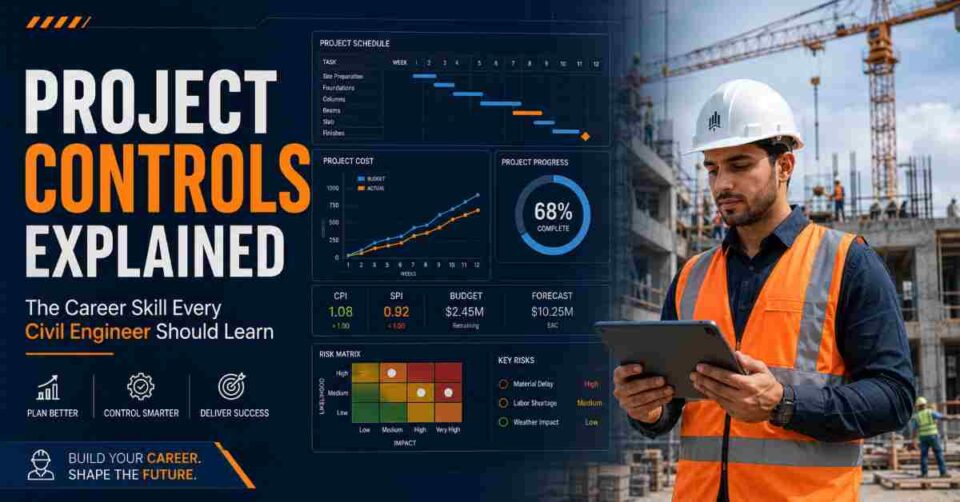
If you have ever watched a construction project spiral past its deadline and budget, you already understand the problem that project controls exist to solve. Project controls is the integrated discipline of planning, monitoring, and adjusting a project’s cost, schedule, quality, and risk from day one through final handover. It is the operating system that turns raw engineering effort into predictable, auditable outcomes.
ConstructionCareerHub App is LIVE — built ONLY for construction careers. Don’t apply with a weak resume.
Get ATS-ready Resume Lab + Interview Copilot + Campus Placement Prep (resume screening, skill gaps, interview readiness) — in minutes & Other advanced features.
Explore Smarter Construction Career Tools →Quick check. Big impact. Start now.
According to the McKinsey Global Institute, large construction projects typically run 80 percent over budget and 20 months behind schedule. The root cause is rarely bad engineering — it is poor visibility into cost variance, schedule drift, and emerging risks. Project controls closes that visibility gap.
For civil engineers eyeing leadership roles — project manager, construction manager, PMC director — mastering project controls is the single fastest way to differentiate yourself from peers who can design but cannot manage. This guide walks you through every core pillar of project controls, explains what the numbers on a live project dashboard actually mean, and shows you exactly how to build this skill set in 2026.
🚀 ConstructionCareerHub — Use the free AI Career Planner to map your transition from site engineer to project controls lead. Get an ATS-ready resume with the Resume Lab and rehearse role-specific interview questions with the Interview Copilot.
Table of Contents
Project Controls vs. Project Management: What Is the Difference?
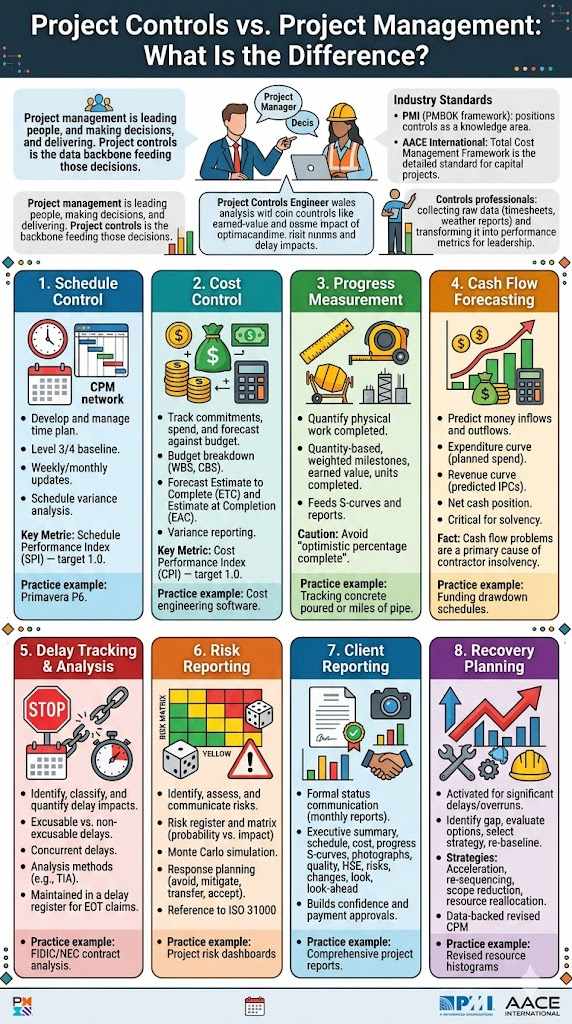
Project management is the broader discipline of leading people, making decisions, and delivering a project. Project controls is the data backbone that feeds those decisions. Think of it this way: a project manager decides whether to accelerate concreting on Block B; the project controls engineer provides the earned-value analysis, cash-flow forecast, and delay-impact scenario that makes that decision evidence-based rather than gut-driven.
The Project Management Institute (PMI) positions project controls as a knowledge area within the PMBOK framework, covering scope, schedule, cost, quality, risk, and communications. The Association for the Advancement of Cost Engineering (AACE International) provides the Total Cost Management Framework, which is the most detailed reference standard for project controls practice in capital projects.
In practice, project controls professionals sit between the field and the boardroom. They collect raw data — timesheets, material receipts, inspection logs, weather reports — and transform it into performance metrics that tell leadership exactly where the project stands and where it is heading.
The Eight Pillars of Project Controls
Project controls is not a single skill. It is a suite of interconnected disciplines. Below is a detailed breakdown of each pillar, why it matters, and how it works on a live construction project.
1. Schedule Control
Schedule control is the process of developing, maintaining, and managing a project’s time plan — typically expressed as a Critical Path Method (CPM) network in tools like Primavera P6 or Microsoft Project. The schedule defines every activity, its duration, predecessor-successor logic, float, and the critical path — the longest chain of dependent activities that determines the project’s earliest possible finish date.
How it works in practice:
- Baseline schedule: Before construction starts, a Level 3 or Level 4 CPM schedule is developed and agreed upon with the client. This becomes the contractual baseline against which all future progress is measured.
- Weekly/monthly updates: The planner updates actual start and finish dates, remaining durations, and logic changes. The software recalculates the critical path and total float for every activity.
- Schedule variance analysis: If an activity on the critical path slips by five days, the project finish date slips by five days unless corrective action is taken. The planner quantifies this variance and flags it to the project manager.
The key metric is the Schedule Performance Index (SPI). An SPI of 1.0 means the project is exactly on schedule. Below 1.0 means behind; above 1.0 means ahead. According to the PMI’s Practice Standard for Earned Value Management, an SPI below 0.85 in the first 20 percent of project duration is a reliable early warning of eventual schedule overrun.
For a deeper look at scheduling tools, see our comparison of the 10 best construction scheduling software platforms in 2026.
2. Cost Control
Cost control tracks every dollar (or rupee, dirham, or pound) committed, spent, and forecasted against the approved budget. Its purpose is simple: ensure the project finishes at or below budget and give leadership early warning when it will not.
The cost control cycle:
- Budget breakdown: The approved budget is broken down into a Work Breakdown Structure (WBS) and Cost Breakdown Structure (CBS), assigning budgets to packages, disciplines, and individual line items.
- Commitment tracking: Every purchase order, subcontract, and rental agreement is logged as a commitment. Commitments represent money the project has promised to spend even if it has not yet been invoiced.
- Actual cost recording: Invoices, timesheets, and material receipts are recorded as actuals — money that has actually left the project account.
- Forecast to complete: The cost engineer reviews remaining scope and estimates the Estimate to Complete (ETC). Adding ETC to actual cost gives the Estimate at Completion (EAC) — the best current prediction of the project’s total final cost.
- Variance reporting: The difference between EAC and the original budget is the cost variance. This is reported monthly to the project manager, PMC, and client.
The key metric here is the Cost Performance Index (CPI). A CPI of 0.92, for example, means the project is getting only 92 cents of planned work for every dollar spent — a 8-percent cost overrun rate. Research published by the AACE International shows that CPI measured at the 20-percent completion mark rarely improves by more than 10 percent for the remainder of the project, making early measurement critical.
To understand the fundamentals of cost estimation that feed into cost control, explore our guide on types of estimates in civil engineering and our estimation engineer career guide.
3. Progress Measurement
Progress measurement quantifies how much physical work has been completed relative to the plan. Without it, you are flying blind — you cannot calculate earned value, update forecasts, or hold subcontractors accountable.
Common methods:
- Quantity-based measurement: Best for repetitive, measurable work. Example: 4,500 of 12,000 cubic meters of concrete poured = 37.5 percent physical progress.
- Weighted milestones: Each activity is assigned a weight based on budget or effort. Completing a milestone earns a defined percentage. Example: “Rebar complete” = 30 percent, “Formwork complete” = 20 percent, “Pour complete” = 40 percent, “Strip and cure” = 10 percent.
- Earned value (percent complete): The planner or engineer assesses the percentage complete of each activity. Multiplying this by the activity’s Budgeted Cost of Work Scheduled (BCWS) gives the Budgeted Cost of Work Performed (BCWP) — also known as Earned Value.
- Units completed: Used for repetitive unit-based work such as pile installation, pipe welding, or cable pulling. Example: 320 of 800 piles driven = 40 percent complete.
Progress measurement data feeds directly into earned value calculations, S-curves, and client progress reports. Inconsistent or inflated progress reporting — often called “optimistic percentage complete” — is one of the leading causes of late-project schedule surprises in construction.
4. Cash Flow Forecasting
Cash flow forecasting predicts when money will flow into and out of a project over time. For contractors, it determines working capital requirements. For clients and developers, it determines funding drawdown schedules from lenders or investors.
How a cash flow forecast is built:
- Expenditure curve: The cost engineer maps planned expenditures against the schedule, producing an S-curve that shows cumulative spending over time. Early-phase spending is slow (mobilization, design), mid-project spending peaks (bulk construction), and late-phase spending tapers (commissioning, demobilization).
- Revenue curve: For contractors, revenue is typically based on interim payment certificates (IPCs) submitted monthly. The forecast predicts when IPCs will be submitted and when payment will be received — factoring in typical client payment cycles (30, 45, or 60 days).
- Net cash position: Revenue minus expenditure gives the monthly net cash position. A negative cash position means the contractor is funding the project out of pocket. A persistent negative cash position can threaten the contractor’s solvency, even on a profitable project.
Cash flow management is especially critical in EPC and lump-sum contracts, where poor front-end loading of the payment schedule can leave contractors exposed for months. According to Statista’s construction industry data, cash flow problems are the primary cause of contractor insolvency in over 60 percent of construction business failures globally.
5. Delay Tracking and Delay Analysis
Delay tracking identifies, classifies, and quantifies the impact of delays on the project schedule. It is essential for both proactive management (taking corrective action) and reactive management (preparing delay claims or defending against them).
Key concepts:
- Excusable vs. non-excusable delays: Excusable delays are caused by events outside the contractor’s control (e.g., force majeure, client design changes). Non-excusable delays are the contractor’s responsibility (e.g., insufficient manpower, poor sequencing).
- Concurrent delays: When both client-caused and contractor-caused delays overlap on the critical path, the situation becomes contractually complex. Most standard forms — FIDIC, NEC, AIA — address concurrency differently.
- Delay analysis methods: AACE Recommended Practice 29R-03 and the Society of Construction Law (SCL) Delay and Disruption Protocol define accepted methodologies, including impacted as-planned analysis, time-impact analysis (TIA), and windows analysis.
The project controls team maintains a delay register — a log of every delay event with its cause, duration, classification, and impact on the critical path. This register is the foundation for Extension of Time (EOT) claims and contractual dispute resolution.
6. Risk Reporting
Risk reporting identifies, assesses, and communicates project risks — events that have not yet occurred but could affect cost, schedule, quality, or safety if they do. The objective is to ensure that the project team and stakeholders understand the risk profile and that mitigation measures are in place.
Standard approach:
- Risk register: A structured database of all identified risks, each rated for probability and impact (typically on a 1–5 scale). The product gives a risk score that determines priority.
- Risk matrix (heat map): A visual tool plotting probability against impact. High-probability, high-impact risks (red zone) demand immediate mitigation plans. Low-probability, low-impact risks (green zone) are monitored but not actively managed.
- Monte Carlo simulation: For large or complex projects, quantitative risk analysis uses Monte Carlo simulation to model the probability distribution of total project cost and duration. Tools like Oracle Crystal Ball, @RISK, and Safran Risk run thousands of scenarios to produce P50 (most likely) and P80 (contingency) values.
- Risk response planning: Each significant risk is assigned an owner and a response strategy — avoid, mitigate, transfer (insurance or subcontract), or accept.
The ISO 31000 Risk Management standard provides the framework most commonly referenced in construction risk management. For a construction-specific deep dive, explore our article on mastering construction analytics, which covers risk dashboards and data visualization.
7. Client Reporting
Client reporting is the formal communication of project status to the client, PMC, lender, or other external stakeholders. It synthesizes all project controls data — schedule status, cost status, progress, risks, delays, and change orders — into a structured monthly report.
A typical monthly project report includes:
- Executive summary with key highlights, issues, and decisions required
- Schedule status: planned vs. actual progress S-curve, critical path analysis, key milestone tracker
- Cost status: budget vs. committed vs. actual vs. forecast, cost variance summary
- Earned value metrics: SPI, CPI, EAC, variance at completion (VAC)
- Progress photographs with date stamps and location references
- Quality summary: NCRs raised, closed, outstanding
- HSE summary: incident statistics, near-miss reports, LTI frequency rate
- Risk register update: new risks, closed risks, changes in risk ratings
- Change order log: pending, approved, rejected, cost and schedule impact
- Look-ahead plan: key activities for the next 3–4 weeks
The quality of client reporting directly affects stakeholder confidence, payment approvals, and dispute avoidance. Engineers who can write clear, data-backed client reports are significantly more promotable than those who cannot. For a broader view of how reporting ties into construction project management, see our comprehensive career guide.
8. Recovery Planning
Recovery planning is activated when a project falls significantly behind schedule or over budget. It is the structured process of identifying the gap, evaluating options, selecting a recovery strategy, re-baselining the plan, and executing it.
Typical recovery strategies:
- Acceleration: Adding resources — more crews, overtime, additional shifts — to compress activity durations. This is the most common recovery method but increases cost. The project controls team models the cost-time trade-off to determine whether acceleration is economically justified.
- Re-sequencing: Changing the order of activities to reduce critical path length. For example, starting MEP rough-in before all structural work is complete (with appropriate safety measures) can recover schedule without adding cost.
- Scope reduction: Negotiating with the client to defer non-critical scope to a later phase. This is contractually sensitive and requires formal change management.
- Resource reallocation: Shifting resources from non-critical activities (those with positive float) to critical-path activities.
- Method change: Switching from cast-in-situ to precast concrete, for example, can dramatically compress structural timelines.
A credible recovery plan is backed by a revised CPM schedule, a resource histogram showing the additional manpower or equipment, and a cost impact analysis. Without this data, a recovery plan is just a promise. This is where project controls expertise becomes indispensable.
If you are considering making the leap from site engineering to project management and need a roadmap, read our guide on how civil engineers build successful project management careers without MBAs.
Sample Project Dashboard: What Every Number Means
Below is a sample project controls dashboard for a hypothetical ₹320 Crore mixed-use commercial project at 52 percent physical completion. Each metric is explained so that even an engineer encountering these numbers for the first time can interpret them.
| Dashboard Metric | Value | What It Means |
|---|---|---|
| Contract Value | ₹320 Cr | Total approved budget for the project. All cost metrics are measured against this baseline. |
| Planned Progress | 56% | Where the project should be according to the baseline schedule at this date. |
| Actual Progress | 52% | Physical work completed to date, measured through quantity surveys and weighted milestones. |
| Schedule Variance | –4% | The project is 4 percentage points behind plan. This gap needs to be quantified in time (days/weeks) through CPM analysis. |
| SPI (Schedule Performance Index) | 0.93 | For every unit of work planned, only 0.93 units have been completed. Below 1.0 = behind schedule. This project needs acceleration or re-sequencing. |
| Budget Spent to Date | ₹183 Cr | Total actual expenditure recorded against the project as of the reporting date. |
| Earned Value (BCWP) | ₹166.4 Cr | The budgeted cost of the work that has actually been completed (52% × ₹320 Cr). This is the “value” the project has produced so far. |
| CPI (Cost Performance Index) | 0.91 | BCWP ÷ Actual Cost = ₹166.4 Cr ÷ ₹183 Cr = 0.91. The project is spending ₹1.10 for every ₹1.00 of earned value — a 9% cost overrun rate. |
| Estimate at Completion (EAC) | ₹351.6 Cr | Predicted total cost at project completion (Budget ÷ CPI = ₹320 Cr ÷ 0.91). The project is trending ₹31.6 Cr over budget unless corrective action is taken. |
| Variance at Completion (VAC) | –₹31.6 Cr | The projected budget overrun. Negative = over budget. This triggers a cost recovery review. |
| Critical Path Float | –12 days | The critical path is 12 days behind the contractual completion date. Negative float means the project will finish late unless recovery action is taken. |
| Open Change Orders | 7 | Seven client-instructed scope changes are pending formal approval and cost/schedule assessment. |
| Active High Risks | 4 | Four risks in the red zone of the risk matrix. Each has an assigned owner and mitigation plan under review. |
| Pending NCRs | 3 | Three Non-Conformance Reports are open — quality defects that need rectification before the affected work can be accepted. |
| LTI Frequency Rate | 0.42 | Lost Time Injuries per million man-hours worked. Below 1.0 is generally considered good performance on commercial construction projects. |
How to read this dashboard as a decision-maker: This project is behind schedule (SPI 0.93) and over budget (CPI 0.91). The negative critical-path float of 12 days confirms the schedule delay is real and not just a percentage artefact. The EAC of ₹351.6 Cr projects a ₹31.6 Cr overrun. The project manager needs to immediately review the 7 pending change orders (potential cost recovery), activate recovery planning for the 12-day schedule gap, and escalate the 4 high-risk items to leadership.
For a detailed comparison of the software tools used to build dashboards like this, see our guide on the 10 best construction analytics and dashboard tools for project controls in 2026.
How AI Is Transforming Project Controls in 2026
Artificial intelligence is not replacing project controls professionals — it is making them dramatically faster and more accurate. Here is how AI is being applied across the discipline in 2026:
- Automated progress tracking: Companies like Buildots use hardhat-mounted 360° cameras and computer vision to compare real-time site images against BIM models, automatically calculating physical progress without manual inspection.
- Predictive delay analysis: Machine learning models trained on historical project data can flag activities likely to slip before they actually do, enabling preemptive re-sequencing. Oracle Primavera Cloud and nPlan are leading this space.
- Automated cost forecasting: AI algorithms analyse commitment patterns, invoice timing, and productivity trends to generate more accurate EAC forecasts than traditional spreadsheet models.
- Natural language reporting: Generative AI tools can draft sections of monthly client reports from structured dashboard data, reducing the reporting burden on project controls engineers by 30–40 percent.
- Risk pattern recognition: AI-powered risk tools scan project data for patterns that historically precede cost overruns or safety incidents — such as rising RFI volumes, declining labour productivity, or increasing weather-day claims.
The McKinsey 2025 Engineering and Construction Practice estimates that AI-enabled project controls can reduce schedule overruns by 15–20 percent and cost overruns by 10–15 percent on large capital projects. For a broader view, read our comprehensive article on AI in construction: 2026 skills and tools that get you hired.
The takeaway for engineers: AI amplifies your project controls skills. It does not replace the judgment needed to interpret data, negotiate recovery plans, or manage stakeholders. Engineers who can combine traditional project controls expertise with AI tool fluency are the most valuable professionals in construction today. Learn more in our career guide on how civil engineers can thrive in the age of AI.
Essential Tools and Software for Project Controls
Proficiency in the right software is non-negotiable for project controls roles. Here are the most important tools by category:
| Category | Industry-Standard Tools |
|---|---|
| Scheduling | Oracle Primavera P6, Microsoft Project, Asta Powerproject, Planera |
| Cost Control | SAP PS, Oracle Unifier, Ecosys (Hexagon), InEight Control |
| Earned Value / Analytics | Microsoft Power BI, Tableau, Safran Analytics, Procore Analytics |
| Risk Analysis | Safran Risk, @RISK (Palisade), Oracle Crystal Ball, Pertmaster |
| Document Control | Aconex (Oracle), Procore, Autodesk Construction Cloud (ACC) |
| Progress Tracking | Buildots, Disperse, OpenSpace, DroneDeploy |
| Integrated PM Suites | Procore, Autodesk Build, Oracle Primavera Cloud, Kahua |
For a detailed breakdown of scheduling tools, read our construction scheduling software comparison. For analytics platforms, see our dashboard tools guide. And for broader construction management software, our 2026 CMS guide covers over 20 platforms.
Project Controls Career Path: Roles, Salaries, and Growth
Project controls is one of the highest-paying specialisations within construction management. Here is a typical career progression with indicative salary ranges based on 2026 market data from Glassdoor, PayScale, and industry surveys:
| Role | Experience | India (₹ LPA) | Gulf (AED/year) | USA (USD/year) |
|---|---|---|---|---|
| Junior Planning Engineer / Cost Engineer | 0–3 years | 4–8 LPA | 72K–120K | 55K–75K |
| Project Controls Engineer | 3–7 years | 8–16 LPA | 120K–220K | 75K–110K |
| Senior Project Controls Engineer | 7–12 years | 16–28 LPA | 220K–360K | 110K–145K |
| Project Controls Manager / Lead | 12–18 years | 25–45 LPA | 300K–500K | 130K–180K |
| Head of Project Controls / Director | 18+ years | 40–70+ LPA | 480K–720K+ | 170K–250K+ |
The U.S. Bureau of Labor Statistics projects 9 percent growth in construction management employment from 2024 to 2034, with approximately 46,800 openings per year. Project controls specialists, particularly those with EVM, Primavera P6, and Power BI skills, are among the hardest roles to fill in large EPC and PMC firms.
For a full breakdown of construction management career paths, explore our guides on construction management careers in 2026 and career progression steps in construction management.
Key Certifications for Project Controls Professionals
Certifications validate expertise and can increase earning potential by 15–30 percent, according to PMI salary survey data. Here are the most recognised credentials:
- PMP (Project Management Professional) — PMI: The gold standard for project management certification. Covers all knowledge areas, including schedule, cost, risk, and quality. Requires a four-year degree plus 36 months of project management experience, or a high school diploma plus 60 months of experience.
- PMI-SP (Scheduling Professional) — PMI: Specifically validates scheduling expertise — CPM development, schedule risk analysis, and baseline management. Ideal for planning engineers moving into project controls.
- CCP (Certified Cost Professional) — AACE International: The premier credential for cost engineering. Covers cost estimating, cost control, planning and scheduling, economic analysis, and project management.
- EVP (Earned Value Professional) — AACE International: Validates expertise in earned value management — the quantitative backbone of project controls.
- CCM (Certified Construction Manager) — CMAA: Focused on construction-specific management competencies including project controls, contract administration, and safety management.
- PSP (Planning and Scheduling Professional) — AACE International: Covers schedule development, maintenance, forensic analysis, and expert testimony — critical for claims and disputes.
For a complete breakdown, read our article on top construction management certifications in 2026 and how to become a certified construction project manager.
How to Build Project Controls Skills: A Step-by-Step Plan
Whether you are a fresh civil engineering graduate or a mid-career site engineer, here is a practical roadmap to build project controls expertise:
Months 1–3: Build the foundation
- Learn CPM scheduling theory — understand critical path, float, logic links, resource levelling
- Complete a Primavera P6 or MS Project beginner course (see recommended courses below)
- Study earned value management fundamentals — BCWS, BCWP, ACWP, SPI, CPI, EAC
- Read AACE’s Total Cost Management Framework (available at aacei.org)
Months 4–6: Get hands-on practice
- Volunteer to assist the planning engineer or cost engineer on your current project
- Build a mock project schedule in Primavera P6 — at least 200 activities with logic, resources, and a baseline
- Create an earned value dashboard in Power BI or Excel using sample project data
- Study delay analysis techniques — read the SCL Delay and Disruption Protocol
Months 7–12: Formalise and certify
- Enrol in a certification prep course (PMP, PMI-SP, or AACE CCP depending on your focus area)
- Apply for project controls roles — Junior Planning Engineer, Cost Control Engineer, or Project Controls Analyst
- Build a portfolio that includes a sample schedule, S-curve, earned value report, and risk register
Recommended online courses:
- Construction Scheduling — Columbia University
- Construction Cost Estimating and Cost Control — Columbia University
- Projects Cost Management, Estimating, Budgeting, and Control.
- Primavera P6 Professional Fundamentals
📘 Recommended ebooks for deeper learning:
- The Civil Engineering Career eBook — Comprehensive career architecture for civil and construction professionals, including project controls career paths.
- The Construction Interview Guide — 200+ interview questions covering estimating, cost control, scheduling, and project management.
- Construction Career Bundle — Combined resume, interview, and career-planning toolkit.
- Remote Construction Jobs Guide — Explores remote and hybrid project controls roles available globally.
🚀 Already working in construction and want a faster assessment? Try the ConstructionCareerHub Career Planner — it generates a personalised 1–5 year career roadmap based on your current role, target market, and skill gaps.
Common Mistakes Engineers Make in Project Controls
Awareness of these pitfalls will save you months of frustration:
- Inflating progress to look good: Reporting 70 percent when the real number is 58 percent creates a false sense of security that collapses during the last 20 percent of the project. Always use quantity-based measurement over subjective estimates.
- Ignoring float consumption: When non-critical activities consume their float, they become critical — but no one notices until it is too late. Track float trends, not just critical-path status.
- Treating the schedule as a static document: A schedule that is not updated weekly or fortnightly is a historical artefact, not a management tool. Live schedules must reflect current reality.
- Separating cost from schedule: Cost variance without schedule context is meaningless. A project can be under budget simply because it is behind schedule (money not spent yet). Always analyse cost and schedule together through EVM.
- Poor change order management: Performing changed work without formal approval creates cost exposure that cannot be recovered. Insist on written change orders before mobilising resources.
Who Hires Project Controls Engineers?
Project controls professionals are employed across every segment of the construction industry:
- EPC contractors: Bechtel, Fluor, Samsung E&A, L&T, Petrofac, McDermott, Wood
- PMC/Owner’s engineer firms: AECOM, Jacobs, Mott MacDonald, Faithful+Gould, Stantec, Hill International
- Government and public infrastructure: NHAI, DMRC, CPWD, TfL, US Army Corps of Engineers
- Real estate developers: DLF, Godrej Properties, Emaar, Nakheel, Brookfield
- Oil and gas operators: Saudi Aramco, ADNOC, Reliance Industries, Shell, TotalEnergies
For company-specific career opportunities, browse the latest openings on ConstructionPlacements.com and use the ConstructionCareerHub Resume Lab to tailor your resume for project controls roles.
Frequently Asked Questions (FAQ)
What is project controls in construction?
Project controls is the discipline of planning, monitoring, and managing a construction project’s schedule, cost, progress, risk, and quality throughout its lifecycle. It uses tools like CPM scheduling, earned value management, and risk analysis to ensure projects are delivered on time, within budget, and to the required quality standards.
What is the difference between project controls and project management?
Project management is the broader leadership function — making decisions, managing teams, and delivering the project. Project controls is the analytical backbone that provides the data, metrics, and forecasts that inform those decisions. A project manager leads; a project controls engineer measures and reports.
What qualifications do I need for a project controls career?
Most project controls roles require a bachelor’s degree in civil engineering, construction management, or a related field. Certifications such as PMP (PMI), CCP (AACE), or PMI-SP significantly enhance employability. Proficiency in Primavera P6, MS Project, and Power BI is typically required. Entry-level positions are accessible to fresh graduates with relevant internships or course projects.
How much do project controls engineers earn?
Salaries vary by region and experience. In India, project controls engineers earn ₹8–16 LPA with 3–7 years of experience. In the Gulf (UAE, Saudi Arabia), the range is AED 120K–220K per year. In the USA, mid-career professionals earn USD 75K–110K per year. Senior and director-level roles can exceed ₹45 LPA, AED 500K, or USD 180K respectively.
What is Earned Value Management (EVM)?
EVM is a methodology that integrates schedule, cost, and scope data to provide a unified measure of project performance. It uses metrics like SPI (Schedule Performance Index), CPI (Cost Performance Index), and EAC (Estimate at Completion) to objectively assess whether a project is ahead or behind schedule and over or under budget.
Which software should I learn first for project controls?
Start with Oracle Primavera P6 for scheduling (industry standard for large projects) and Microsoft Excel or Power BI for cost tracking and dashboards. Once comfortable, add Microsoft Project for smaller projects and Procore or Autodesk Construction Cloud for integrated project management.
Can I move into project controls from a site engineer role?
Yes. Site engineers already have field knowledge of construction sequencing, productivity rates, and quality requirements — all essential inputs for project controls. The transition typically involves learning scheduling software, EVM methodology, and cost control processes. Many professionals make this move within 2–3 years with focused upskilling. See our detailed guide on transitioning from civil engineering to project management.
What is the future of project controls?
The future is data-driven and AI-augmented. Automated progress tracking (computer vision), predictive delay analysis (machine learning), and real-time integrated dashboards are becoming standard on major projects. However, human judgment for risk interpretation, stakeholder management, and recovery planning remains irreplaceable. Engineers who combine traditional controls expertise with AI tool fluency will be in the highest demand.
Last updated: May 2026. Data and salary figures reflect current market conditions and may vary by employer, project type, and location.
